
Immunome Browser maps and visualizes queried in IEDB linear peptidic epitopes along the length of a protein sequence (a target, or reference, protein). The purpose of the tool is to allow users exploring how often each protein region has been studied in immune assays and in how many assays the immune response was positive or negative.
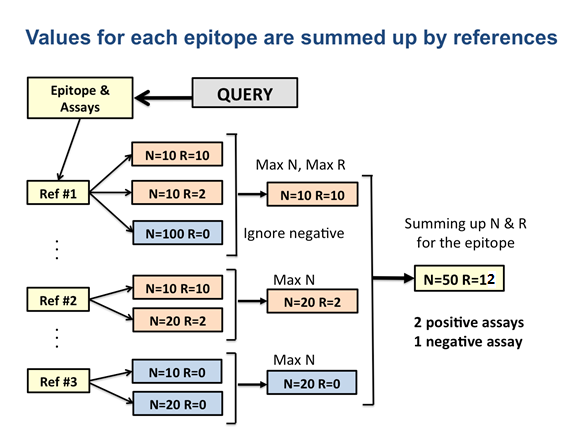
Immunome Browser provide a summarized data by reference antigens; and the main reasons for doing that are the following: (i) epitopes reported in IEDB were identified for different strains and protein isoforms – mapping to the reference protein allows to visualize and study such epitopes as they would have the same antigen; (2) different mutant variants of the same epitope were tested and reported; and (3) immune response varies among studies and assays due to heterogeneity of samples and complexity of immune response.
Immunone Browser is accessible in IEDB via two entry points (or tabs): either the Antigen or Epitope navigation paths.
The Word-file of this tutorial can be downloaded as an attached file below.
To get started, run the following query:
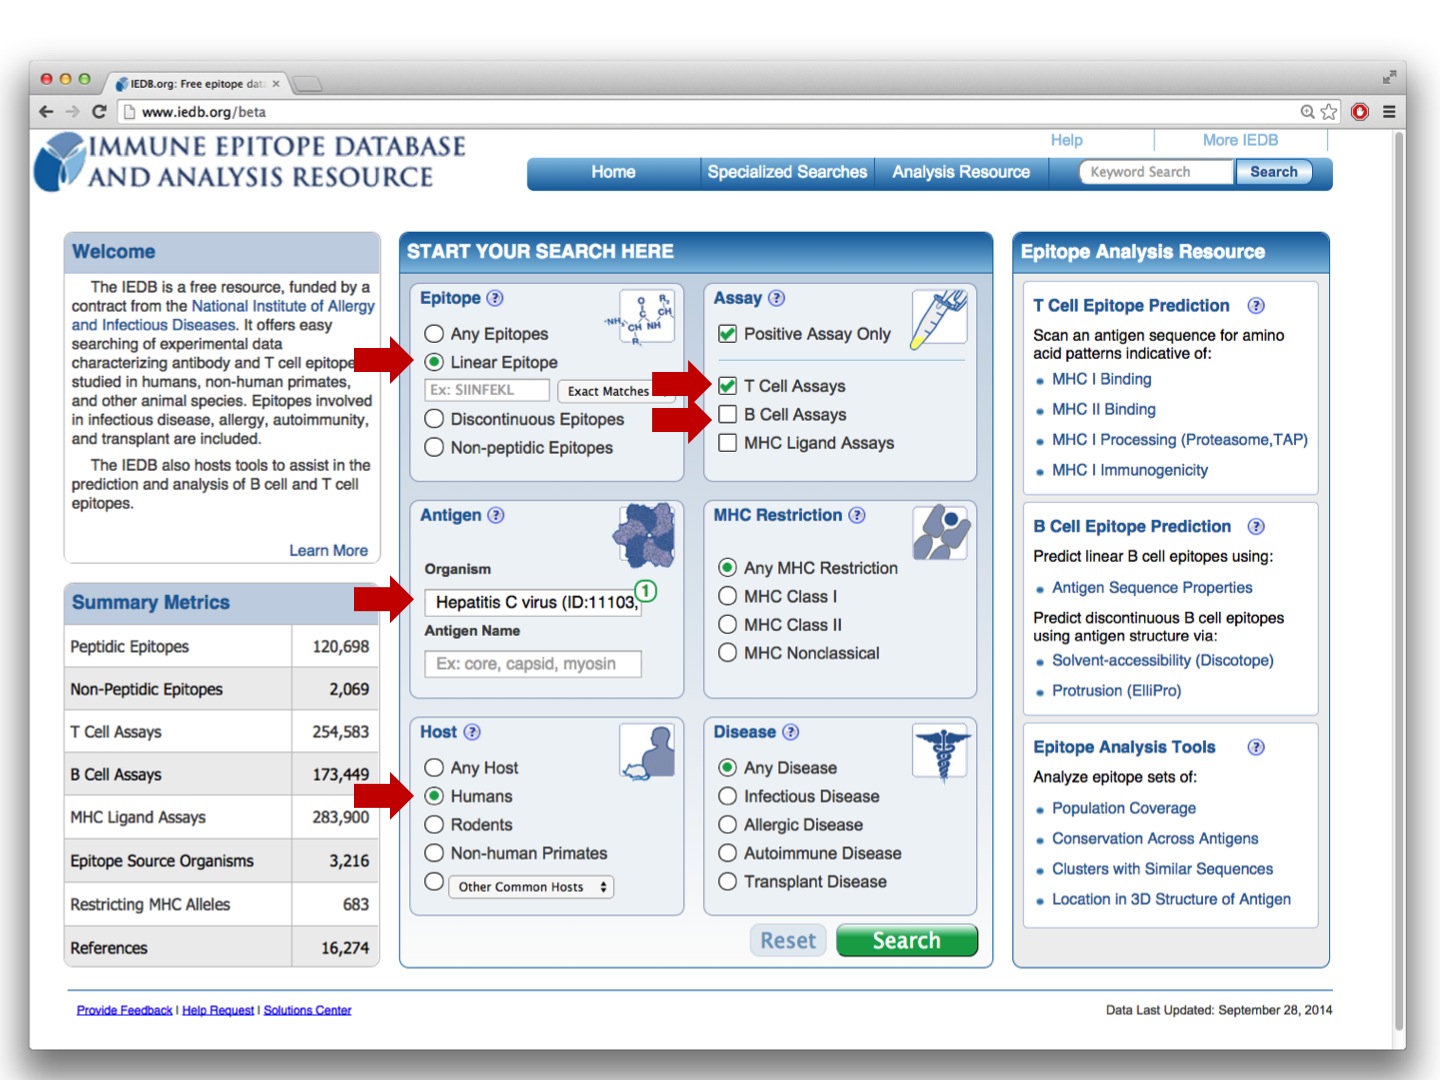
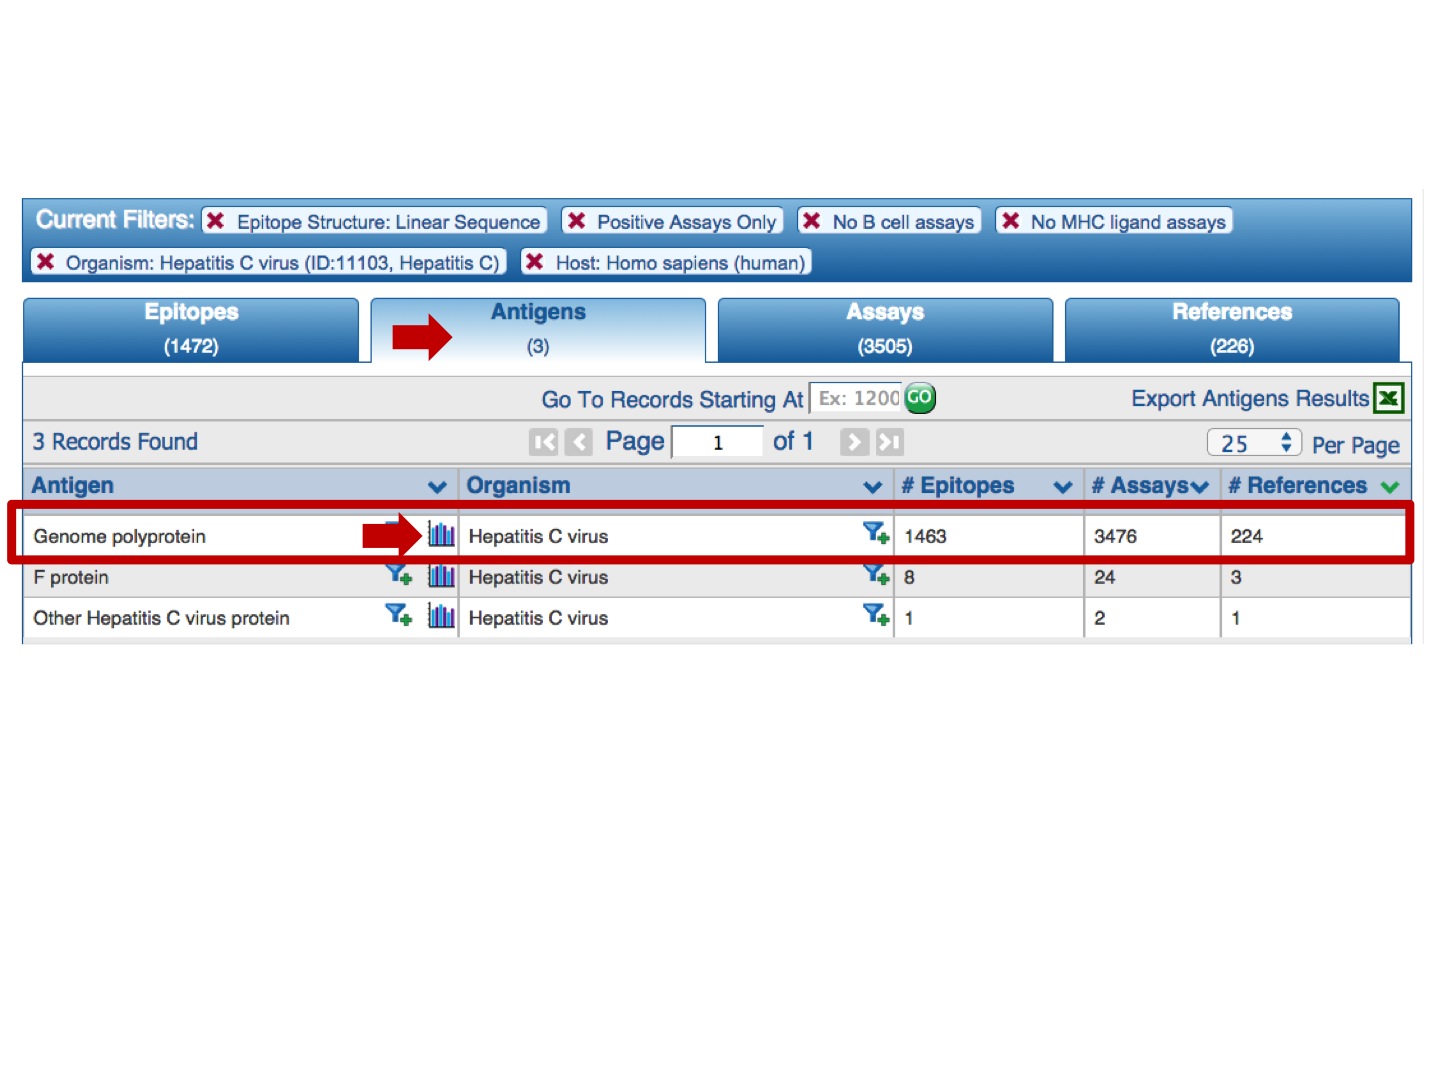
and click on the Immunome Browser icon:
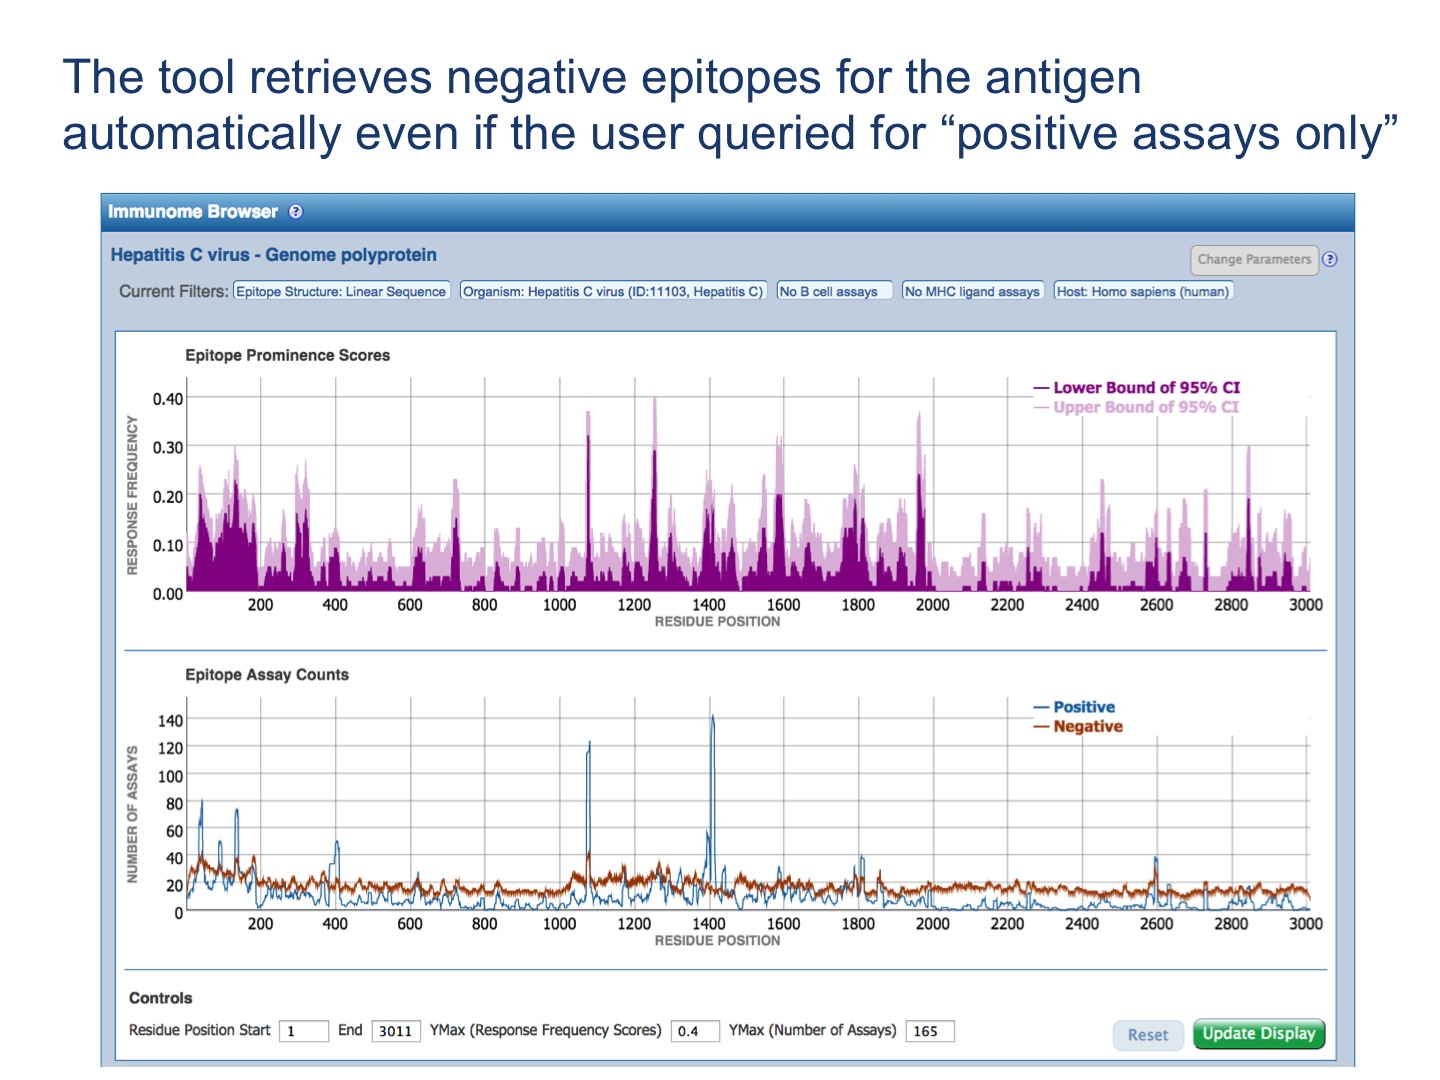
Each selected antigen is considered to be a target protein, and the tool by default maps and visualizes all epitopes in the query result that are from the source antigen which is the target protein or any of its taxonomic child. The mapping is done using the alignment between the source antigen and the target protein and matching the epitope positions in the source antigen with the residue positions in the target protein (* -- the default mapping criteria are provided below). Note, by default, epitopes that were tested as negative for the correspondent query will be mapped as well, even if the user queried only for positive assays. Also, the epitopes that failed to satisfy the default mapping criteria won’t be mapped and visualized. Note that if there is no Immunome Browser icon for any Antigen, either the epitopes are non-peptidic or there is no available reference proteome to map the epitopes onto.
Immunome Browser outputs two plots and the table.
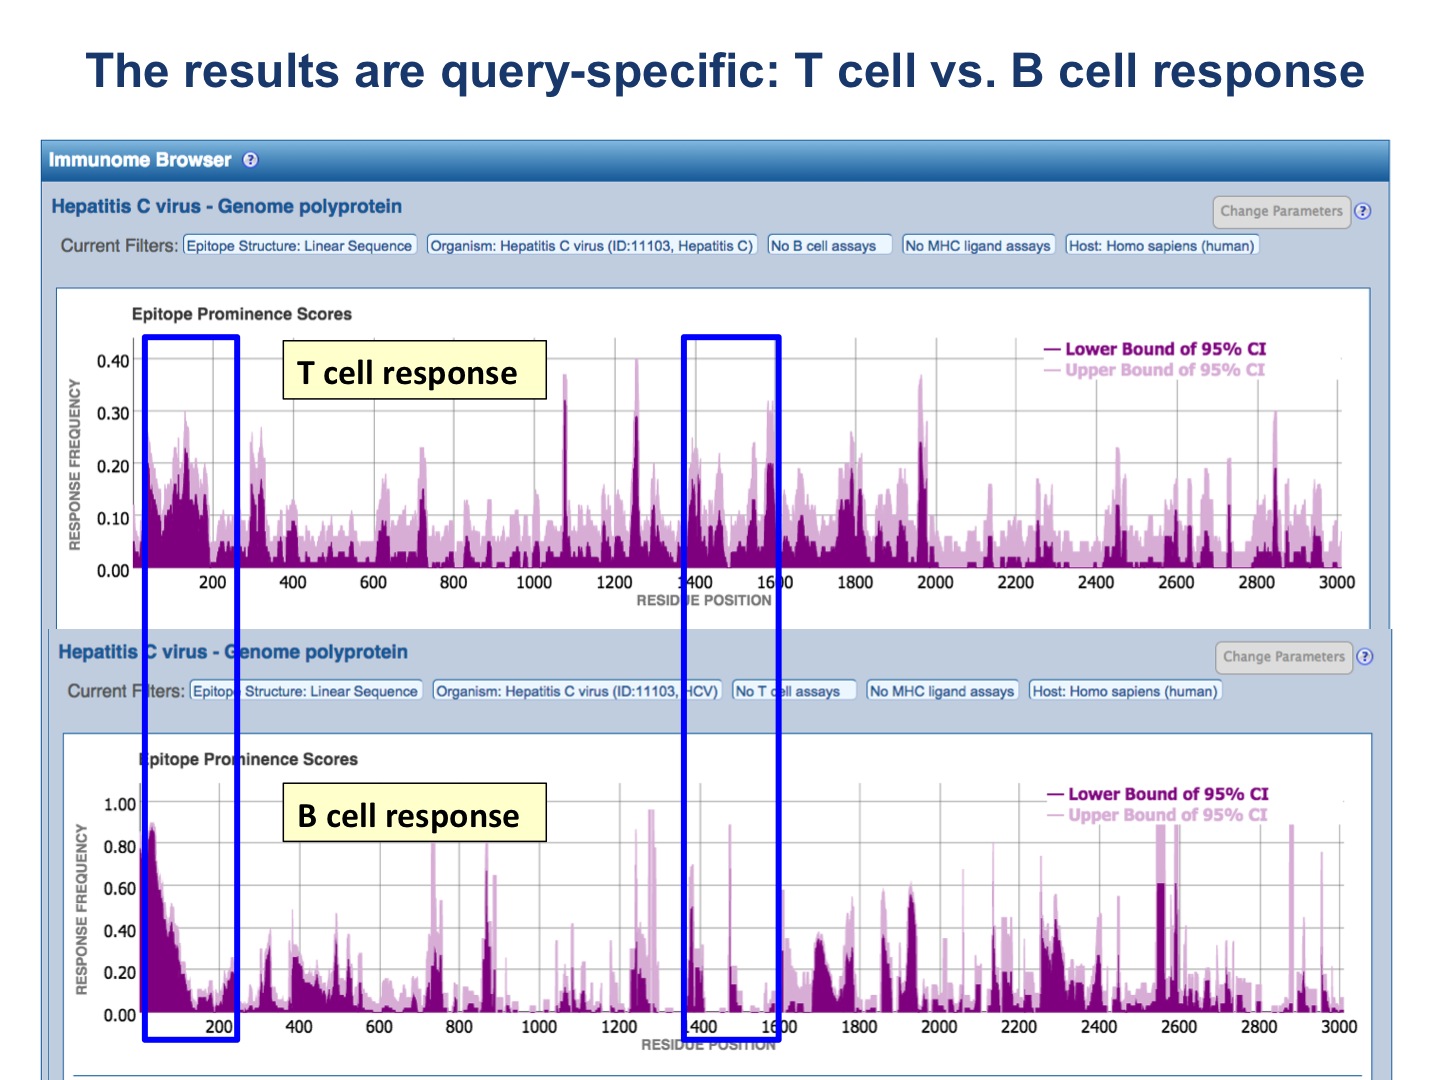
The results are query-specific! See the following figures for examples.

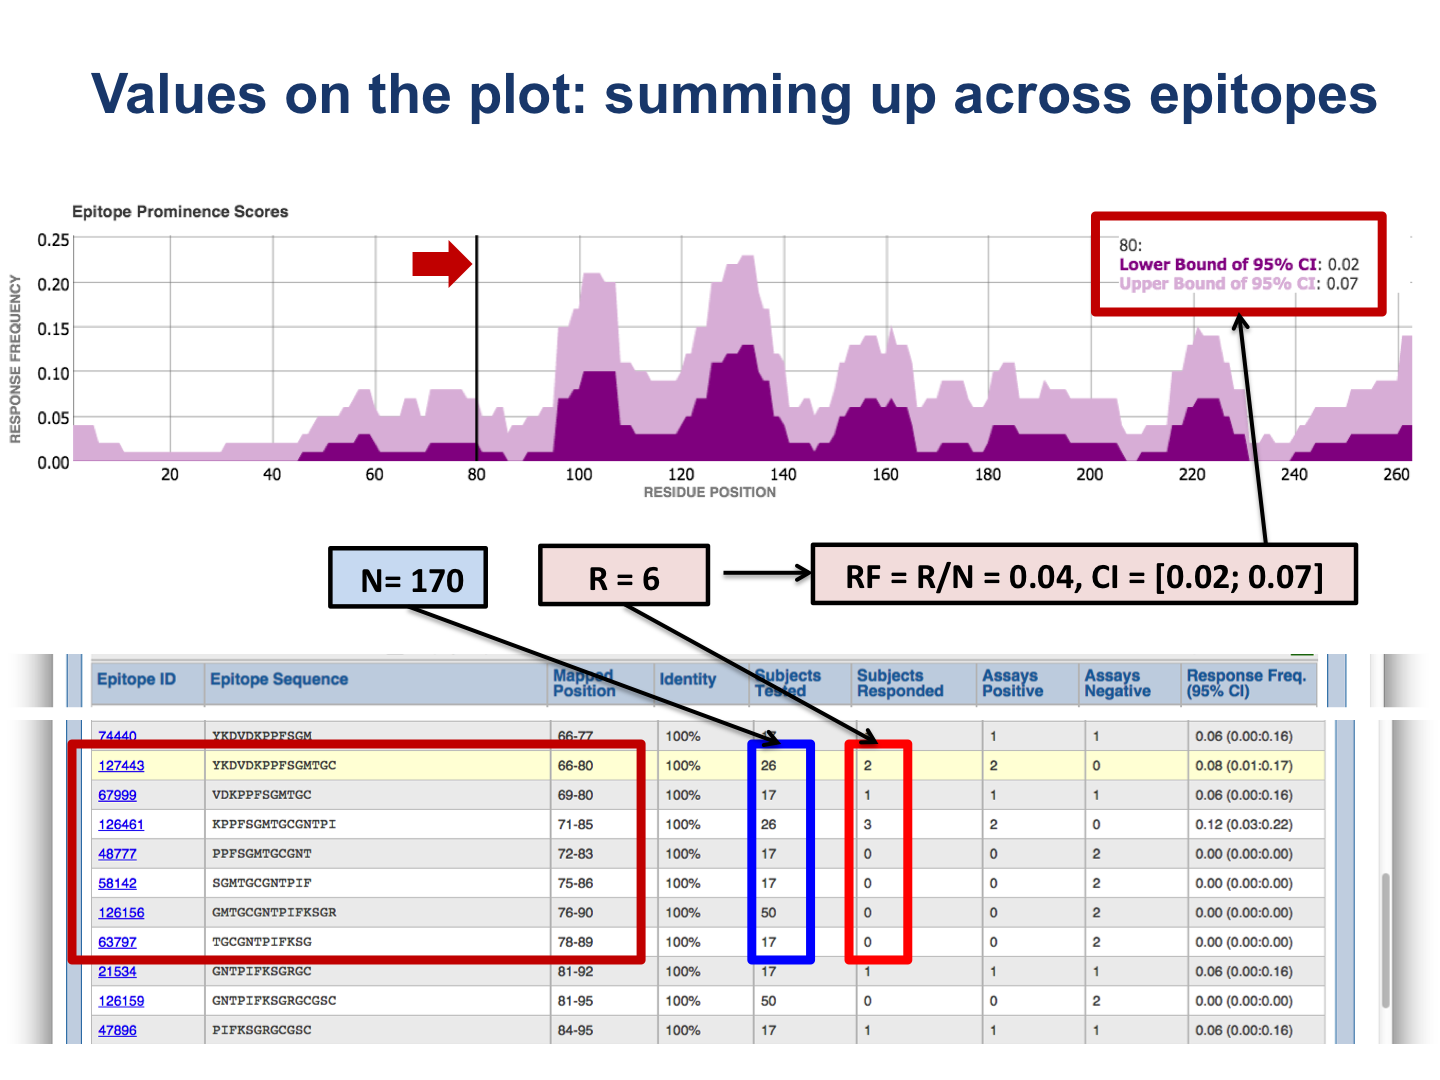
The upper plot renders the lower (dark color) and upper (light color) bounds of the 95% confidence interval (CI) of the response frequency (RF)** for each position target protein position, averaged over all epitopes mapped to that position. RF is calculated as the number of positively responded subjects (or individuals in this case) relative to the total number of those tested summed up by mapped epitopes. Note, however, that the graph displays only the upper and lower bounds of the 95% confidence interval (CI) for the RF score and not the RF score itself.
The bottom plot shows the number of positive and negative assays averaged over epitopes mapped to each position of the target protein.

The table presents results for each epitope. The figures below provide explanation how values in the table are calculated.

Note the essential difference: the plots depict values defined for each residue position in the target protein; while the table displays the values of the RF score and CI for each epitope.
The user can interactively zoom in and out the plots to a specific protein region and, if the check box for the table to correspond the plots is selected, the table is automatically updated to show only epitope from the selected region.
---------------------------------------------------------------------------------------------------------------------------------------------------
* Default mapping criteria:
- Source protein and target alignment: NCBI Blast is used with default parameters. If less than a half of the length source protein were aligned or the epitope match didn’t satisfy identity criteria, the needlman-wunsch algorithm for global alignment was used.
- Epitope matching criteria:
- Short epitopes of length <= 5 aa. Sequence identity = 100%, no gaps in the matching alignment.
- Long epitope > 5 aa. Sequence identity >= 50%, maximum length fraction of gaps in the alignment (for each source and target) = 20%.
- Long epitopes (> 5 aa) that have multiple exact matches in the source protein. Sequence identity >= 70%, sequence similarity (based on BLOSUM62) = 100%, no gaps in the matching alignment.
** Response Frequency (RF) and Confidence Interval (CI) calculation:
N is the number of subjects tested, and R is the number of subjects responded.
If an assay lacks information on the number of subjects responded or tested, the following values of N and R are used:
R = 1, N = 1, if the assay outcome is positive;
R = 0, N = 1, if the assay outcome is negative.
Reporting CI instead of directly calculated RF (RF = R/N) allows correcting for the sample size. Otherwise, a peptide found to be positive in only one donor (R=1; N=1) would be considered more immunogenic than a peptide showing response in 99 out of 100 donors as the former has the RF score of 1.0 and the latter of 0.99. However CI will be very large in the former case, and small in the latter.
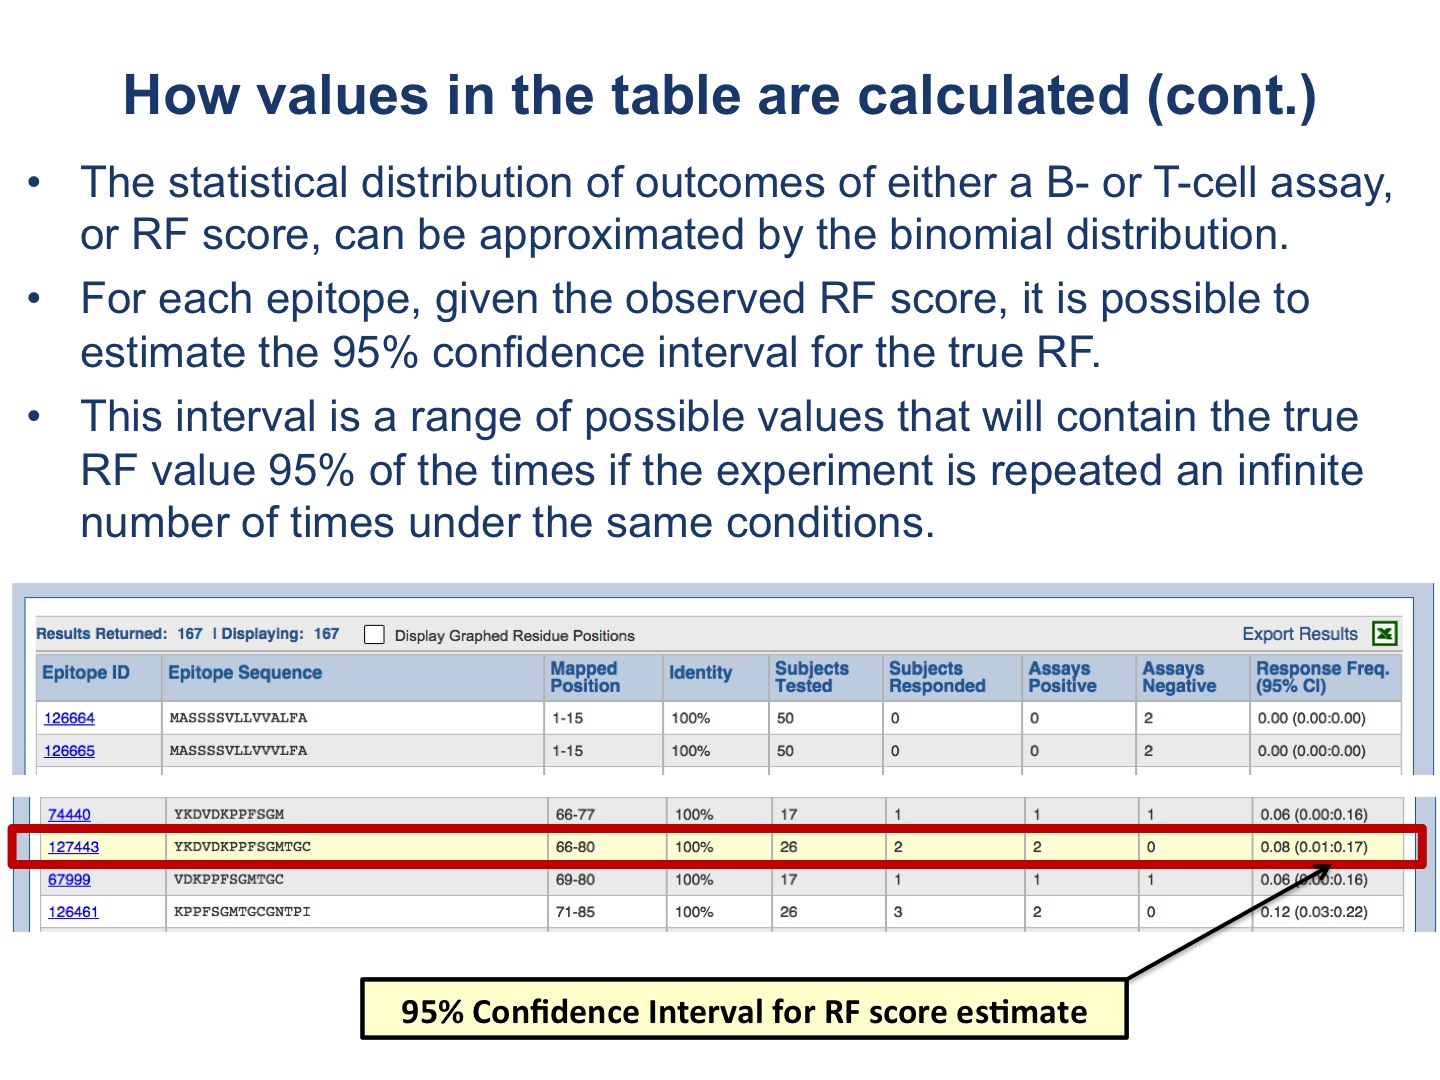
The 95% CI is a range of possible values that will contain the true RF value 95% of the times if the experiment (same epitopes & assays) is repeated an infinite number of times under the same conditions, assuming that the statistical distribution of outcomes of either a B- or T-cell assay can be approximated by the binomial distribution as, in general, the following conditions of experiments are satisfied: (1) an assay is repeated for a fixed number N of tested subjects; (2) each tested subject can show only two possible outcomes (response or no response); (3) the probability of response, or no response, is the same for each subject; and (4) the subjects are statistically independent (see http://en.wikipedia.org/wiki/Binomial_distribution ).
CI (light pink area on the upper plot) ranges from 0 to 1.0.
Given the observed RF score, which is binomially distributed, it is possible to estimate the 95% CI for the true RF. There are several ways to compute a confidence interval for a binomial proportion (see http://en.wikipedia.org/wiki/Binomial_proportion_confidence_interval). One of the widely used formulas is the Wilson score interval. It was shown however that for small sample size (or N, the number of tested subjects) the Wilson interval underestimates the error (http://www.ucl.ac.uk/english-usage/staff/sean/resources/binomialpoisson.pdf ) and a continuity-corrected version of the Wilson interval is suggested. Therefore, the Wilson score interval was used for N>=50, and the lower bound of 95% CI was calculated as:
(((R/N) + 1.96*1.96/(2*N) - 1.96 * sqrt(((R/N)*(1-(R/N))+1.96*1.96/(4*N))/N))/(1+1.96*1.96/N));
while, the upper bound as:
(((R/N) + 1.96*1.96/(2*N) + 1.96 * sqrt(((R/N)*(1-(R/N))+1.96*1.96/(4*N))/N))/(1+1.96*1.96/N))
For N<50, we calculate the approximations for CI directly based on the binomial cumulative distribution function.
Comments
0 comments
Article is closed for comments.